Providing Visibility Using Automated Reporting
Project Type: Assessment
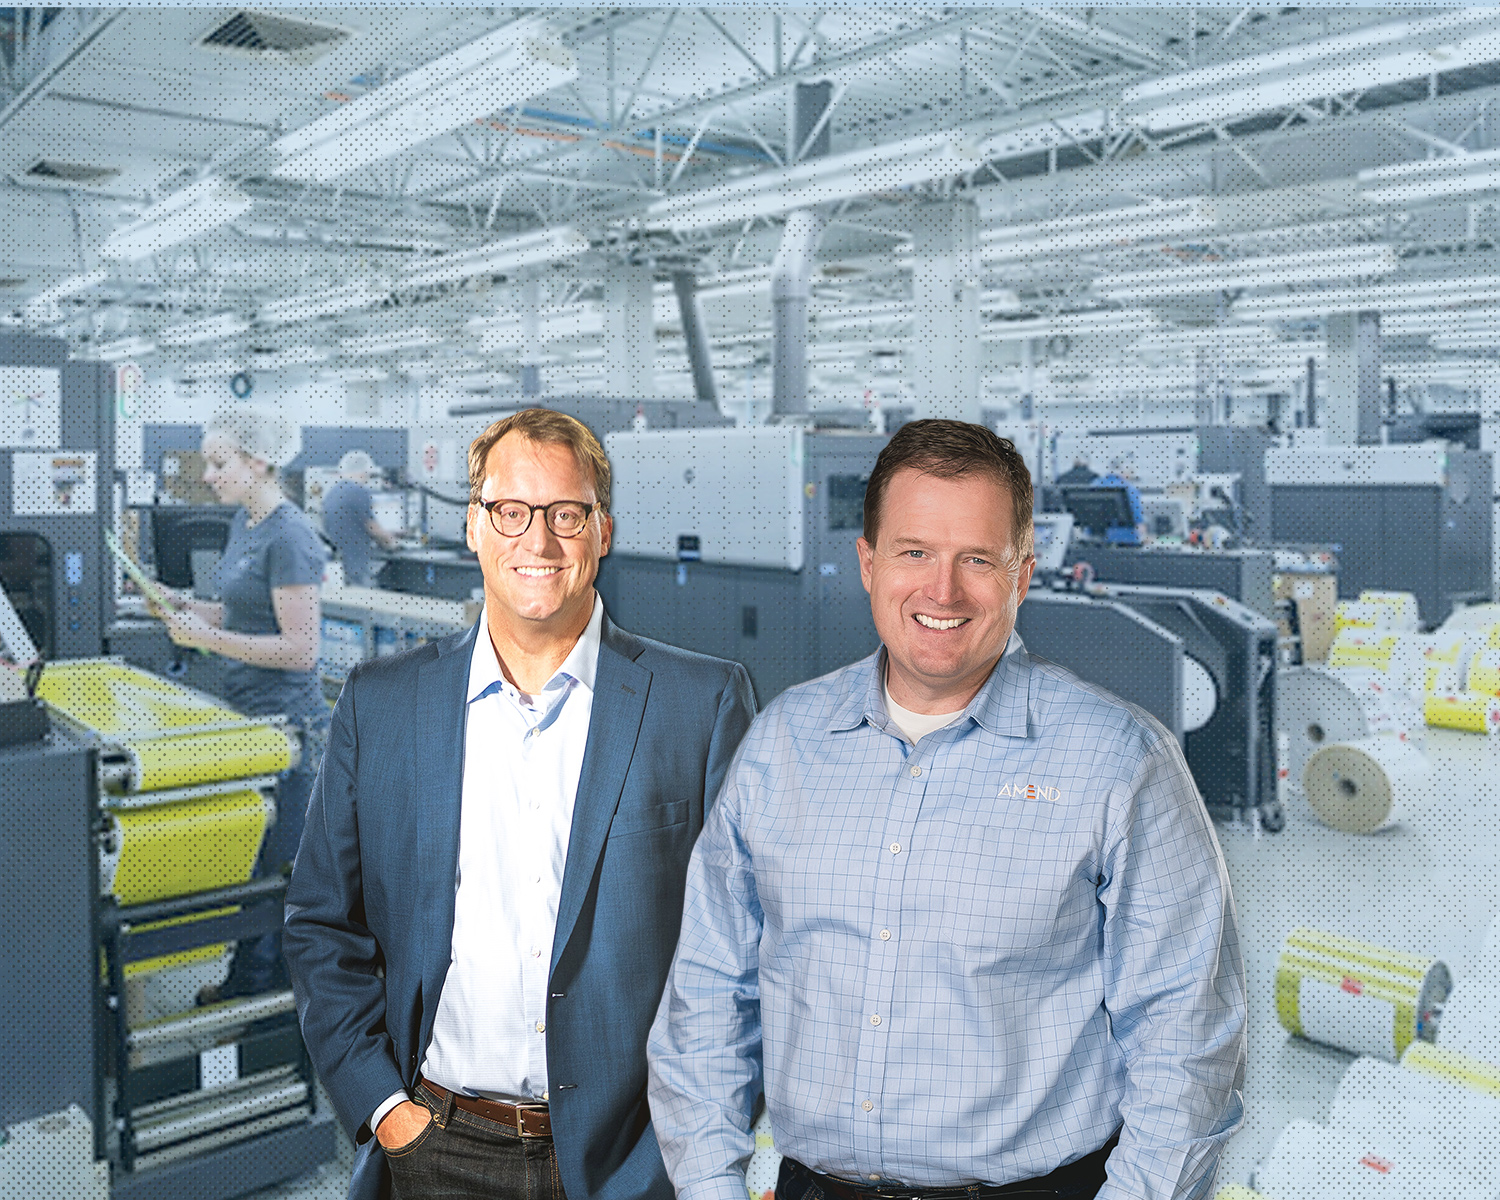
The Salyers Group is the parent company for Fabulous Furs, Fabulous Bridal, the Madison Event Center, and other ventures. As a parent company, there was a desire to add more visibility to the current state of the businesses and improve each individual company with the use of technology and automation.
AMEND’s experience with aggregate reporting and Microsoft Power BI drew the Salyers Group to reach out. After our 6-week assessment, we had a functioning, validated reporting package and future-reporting roadmap that will give the Salyers Group the visibility they need, in addition to an executive summary view in the future-state. This initiative will increase efficiency, drive the right conversations, and allow for strategic planning.
Overview
-
Company Overview
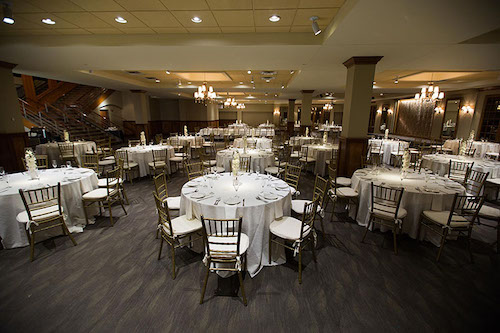
- Industries: Real estate, retail, entertainment, apparel catalog, and event receptions
- Privately-held
-
Assessing the Landscape
- A diversified investment company holding assets in real estate, retail, entertainment, apparel catalog, and event receptions
- Family-owned with headquarters and portfolio businesses all located in Covington, KY
- Employees performing manual reporting with data that needed to be cleaned up
-
Identifying Opportunity
- Automating the reporting process focusing on key metrics
- Cleaning the data and correcting the data entry process to increase the accuracy
- Customized tracking and reporting for individual business improvements vs. high-level executive summaries
Assessment Results
Reporting
Completed Power BI Dashboards with key metrics to support day-to-day business operations and future growth in 4 weeks
Automation
Eliminated manual reporting and significantly decreased time spent manipulating data for the General Manager and sales staff
Strategy
Outlined effort and plan to build additional reports for operations, finance, and other business areas
The Solution
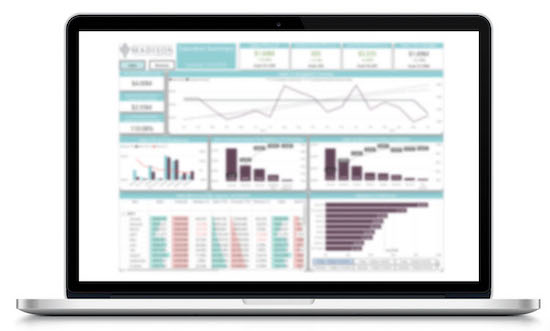
Automated Power BI Dashboard
We created an automated Power BI Dashboard for a portfolio business, including metrics supporting capacity, sales, and costing departments.
The team was able to connect to multiple different systems to combine and analyze data. Being able to see capacity, sales, and costing at a snapshot has allowed the team to focus on actively improving the business, instead of spending time just trying to get the numbers.
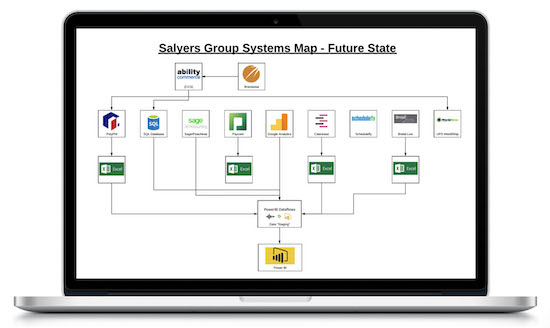
Opportunity Prioritization
We defined the root cause and narrowed in the focus of automation by prioritizing the opportunities by the greatest impact.
The future-state vision outlined the recommended next steps for creating dashboards, which were aligned with the organization’s goals. The team was excited and ready to tackle the next steps, knowing they were agreed upon by the management team.
The AMEND Assessment Process
Assessment Playbook Process
-
- Interviews, systems research, feasibility analysis, Gap to Perfect, and other tools were used to gather information quickly and efficiently to identify the root causes.
Iterative Working & Feedback Cycles for Power BI
For the best results on the Power BI dashboard, we completed works in waves, getting frequent feedback to meet the client's needs and expectations along the way.
Alignment with the Executive Team
-
- Having the executive team engaged in the process and excited about next steps helped to map out the long-term strategy together to ensure it met the needs of the team.

-
 “AMEND was ready to dive into our business from our very first meeting. They spent weeks getting to know our people and processes, they wanted to walk in our shoes and gain a complete understanding of the business. They catered to every individual’s needs, questions and concerns while working right alongside us through the entire project. From start to finish, it was a pleasure to work with our AMEND team and the end result is invaluable, our reporting dashboard is exactly what we asked for and more.”
Brittney Lee
General Manager, The Madison