By: Joe Ratterman
Prime time, the biggest stage, the biggest audience, the biggest spend. Companies spend millions of dollars on ads each year during the Super Bowl with the hopes of maximizing audience reach. This year’s contest was no different. Despite several large companies opting out of the prime airtime, early estimates indicate that a 30-second slot during Super Bowl LV would have cost $5.5MM.
With big spend comes big expectations. Does this large, one-time spend payoff in the long-term? Are these companies/brands generating conversation around their products? Although the long-term results of a Super Bowl ad can’t be quantified in the following week, data does exist for the second question – it’s just a matter of finding it. Though social media companies don’t give out nice, clean datasets for free – they do make raw data accessible if you know where to look. The AMEND team took the challenge & scraped data from Twitter to see which companies were able to generate the largest buzz during the game.
[ Looking to find and gain insights from market data? Not sure where to begin dissecting your organization’s data? Fill out the form at the bottom of this page.]
Methodology
To start, the team scraped data from Twitter[i] from 12:00am 2/7/2021 – 11:59pm 2/7/2021. Using tweets before the game allowed for a baseline comparison of total interaction & helps quantify how large (or small) the interaction changed following an ad. Brands we were interested in ranged from Chipotle, to Doritos, to Bud Light, and even The Weeknd. [ii] To pull the data, we compiled a list of key words for each brand: for example, the search for Chipotle included their Twitter handle – @ChipotleTweets as well as ‘Chipotle’. After setting the final list of keywords we set the scraping tool to work. Our dataset was generated over the course of around 12-hours, including the entire ETL process into the database. Of course, having the data is great, but finding the story it tells is where the fun begins.
The Results are in…
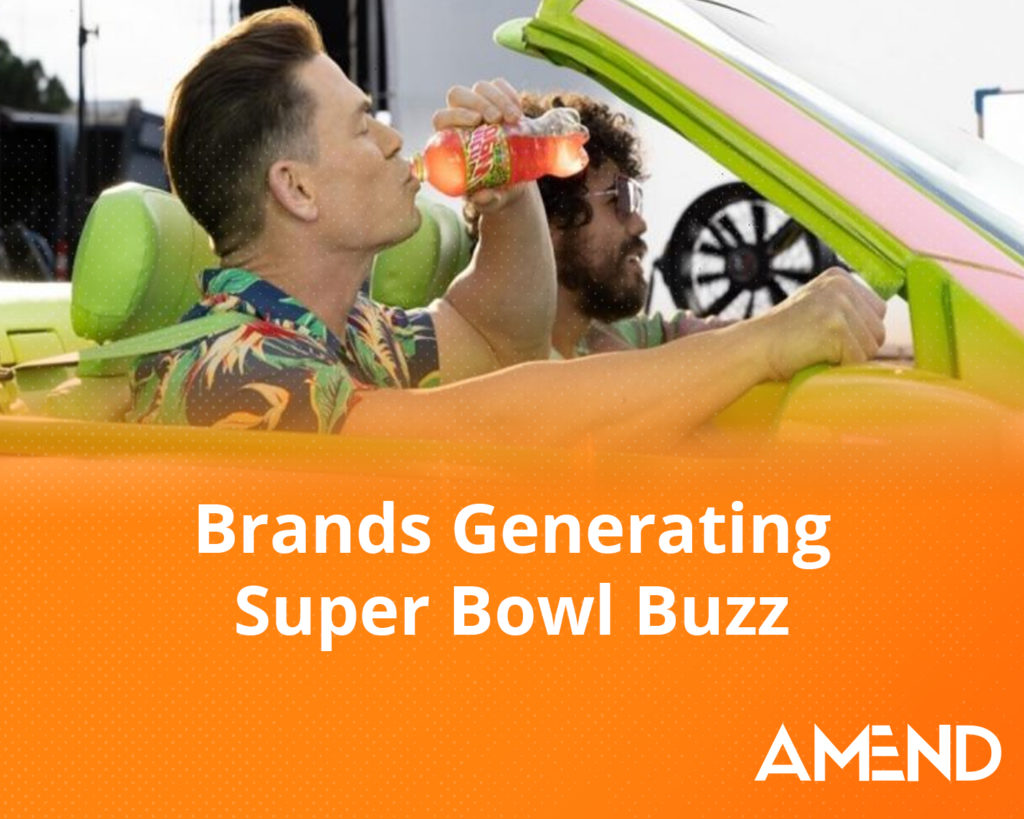
The resulting dataset contained around 1.1MM Tweets throughout the day on 2/7, giving us the opportunity to dissect and rank which brands spent their money wisely, along with those that may not have gotten an impactful ROI. In a runaway, the brand winner for most tweets during the Super Bowl was Mountain Dew (293,158) seeing nearly 5x more tweets than the next closest brand – which ironically was Pepsi. Although Pepsi didn’t have a formal commercial slot, they were included for sponsoring the halftime show. In addition to garnering the most tweets, Mountain Dew also saw a 33891% increase in tweets during the Super Bowl time frame (6pm – 11:59pm). This incredible growth can likely be attributed to their selected commercial – one that called out viewers to tweet them to guess the number of bottles in their commercial. While every brand we researched saw an improvement in total tweets, one that perhaps capitalized more than most was Hellmann’s Mayo, which saw an 8500% increase in tweets during the Super Bowl (2nd highest) despite their models 2,855 tweets.
In addition to the total tweets, we developed a ‘Total Impressions’ calculation based on a Tweet’s Likes, Retweets, and Quotes to better capture a company’s footprint. Twitter does not make data readily available to show which user saw what tweet, so this was our next best option. The results did not differ greatly from total tweets, as one would expect. That being said, it does give a closer basis for dollars spent / impression.[iii] The top three in this category were State Farm, Mountain Dew, and Uber Eats at $12, $14, and $16, respectively.
While companies varied in success for reaching a large audience, one brand in particular did an exceptional job – The Weeknd. The lead halftime performer accumulated 6.9MM impressions on Twitter between 6pm – 11:59pm, just over a 2000% increase from his pre-Super Bowl baseline. Using the same $5.5MM commercial baseline[iv], he would have had a shocking $0.79 / impression during the Super Bowl – perhaps doing more for his brand than any other company shelling out money for the game.
Want to see the data yourself? Check out the Power BI Dashboard below containing summary data along with a bar chart depicting impressions over the course of the day.
Report may take a moment to load. For best viewing on desktop, tap the arrow in the bottom right corner to open in full-screen mode. On mobile, view in landscape mode. To toggle between tabs, tap the > arrow at the bottom of the report screen or tap “1 of 2.”
[i] https://github.com/JustAnotherArchivist/snscrape
[ii] A full list of brands can be found in the accompanying Power BI Dashboard
[iii] This calculation does not account for commercial quantity or the total duration of the commercial(s).
[iv] Most Super Bowl Halftime performers get a $13MM Budget & perform for free – however, The Weeknd reportedly spent around $7MM of his own money.
Joe Ratterman is a Project Leader focusing on technical solutions for clients. His skills and interests include process automation, data wrangling, and predictive modeling. Using these skills, he is able to build custom, sustainable tools to drive growth and efficiency gains for clients from a variety of industries.
Our team develops solutions to fit your performance-driving KPIs and support your short and long-term strategy planning. Fill out the form below if you’re interested in partnering with AMEND to dig deep into your data to unlock value in your organization.
Related Posts
 Maximize ROI by Investing in the Right IoT Technology
 Small Business, Big Purpose: Why I Keep Coming Back for More
 Swallow your pride – and pay your sales team!
 Is It Time For You To Branch Out?
 Utilize IoT in Your Business and Discover Untapped Opportunities
 Why AMEND? Because Excellence Isn’t An Accident