Let the madness begin…
This year, teams faced strict protocols to limit the spread of COVID-19, which lead to many delayed games, canceled practices, and altered travel plans. Despite the challenges surrounding this year, the 2021 edition of March Madness is set to tip-off at noon on 3/19 (play-in games on 3/18). In a year with so much uncertainty, we’re here to help shed a little light on what the numbers say about this year’s tournament. So, if you’re still tinkering with your bracket or want to see what upsets to cheer for – read on.
To help make our predictions, we did what we do best – gather as much data as possible and determine “the how” to utilize it most effectively. Our dataset includes box score results for each Men’s NCAA Division 1 basketball game. This dataset includes traditional stats, such as points scored, assists, etc., and advanced stats such as defensive efficiency, effective field goal percentage, etc. Though these stats are highly effective in predicting college basketball games, we took it one step further and developed weighted moving averages for our selected features. For example, using a team’s offensive efficiency for each game of the season, we can calculate a weighted moving average – giving higher weights to more recent games. This helps to identify which teams are improving entering into the tournament and which are regressing.
After completing the dataset, it was time to build the model – the final model we landed on predicts the outcome for each potential matchup (over 2000!) in the tournament – giving the probability that Team A beats Team B. Using these probabilities, the entire tournament is simulated 100,000 times to find the most common outcomes round-by-round.
The results are in… below are the most common winners for each game from the Elite Eight to the Championship.
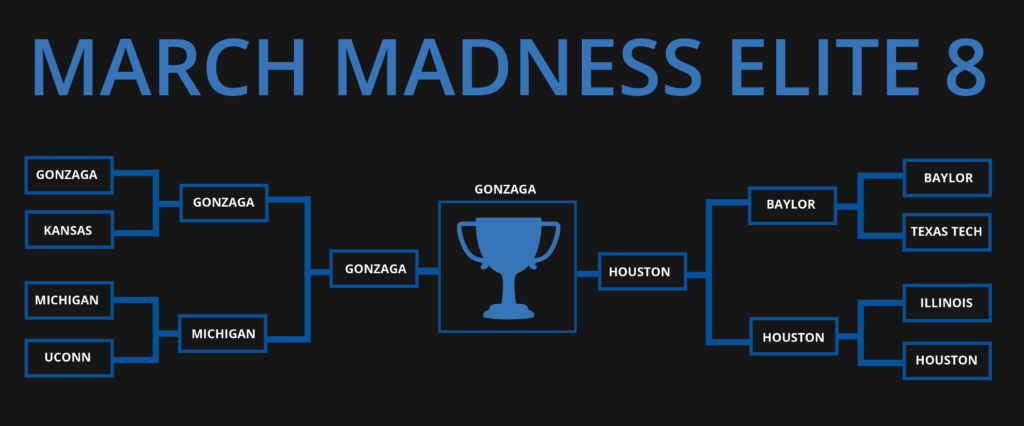
Gonzaga was the big winner of our simulation, winning the tournament over 21,000 times – beating out Houston (15,000 wins). Upon reviewing the results, it is evident that the model favors teams with high offensive efficiency (OF) & defensive efficiency (DF). Having both is key for making a deep run in the tournament, as you play a variety of teams with different playing styles. If you read our article last week, it will not be a surprise to see Gonzaga, Michigan, Baylor, & Houston in the Final Four as all of these teams are in the Top 25 in OF & DF. UConn is a bit of a sleeper team, making the Elite 8 consistently as a 7 seed. However, they also rank just inside the Top 25 in both OF & DF, giving them the balance needed.
Although the simulation didn’t result in any 10-16 seeds making a Cinderella run, there are a few teams that did make it to the Sweet 16 fairly consistently. If you’re looking to spice up your bracket with a few upsets, look no further than these teams.
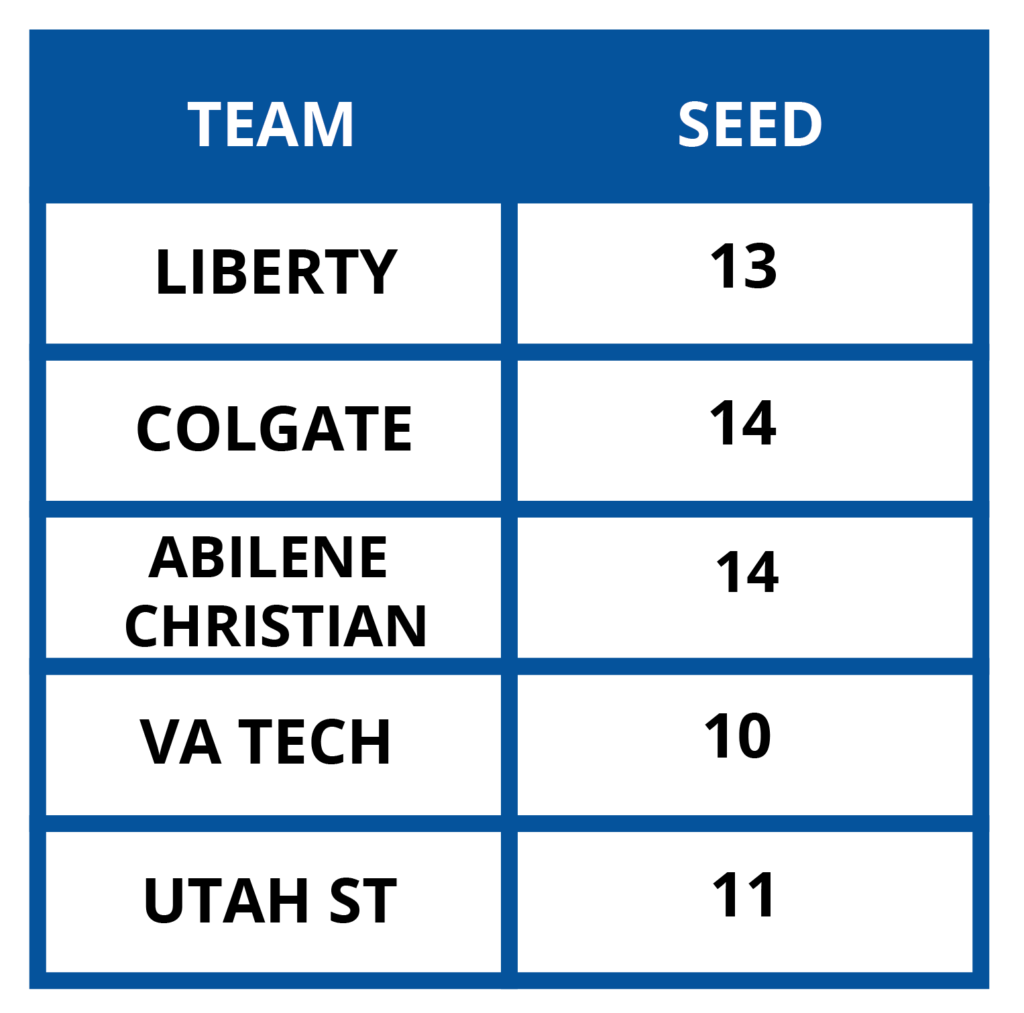
In addition to watching for these upsets – consider what the high seeded teams are in the same portion of the bracket as these teams – they are primed to be early exits, despite a successful season and generous ranking from the committee. A few of these teams are Ohio State, Arkansas, Alabama.
Forward-looking predictive and prescriptive analytics can uncover insights that explain how your business operates. Our world-class data scientists clearly explain predictive insights and incorporate them into company strategy.

Joe Ratterman is a Project Leader focusing on technical solutions for clients. His skills and interests include process automation, data wrangling, and predictive modeling. Using these skills, he is able to build custom, sustainable tools to drive growth and efficiency gains for clients from a variety of industries.
Fill out the form below if you’re interested in partnering with AMEND to dig deep into your data to unlock value in your organization.